Photo by Oliver Rye
It’s easy to experience a bad snow season, or two or three in a row, and extrapolate that to a persistently negative view, completely forgetting the bottomless powder from the seasons prior, or seasons to come. This ‘negativity bias’ is particularly acute in younger people, before fading with age…so at least we’ve got that to look forward to! Interannual variability in snowpack processes, combined with near-decadal scale variations such as the El Nino Southern Oscillation (ENSO) produce erratic snowpacks that can make it hard to put a finger on just what is going on with the snow. Further complicating matters is that snow enthusiasts tend to sample snow and water in a biased way, when considering a complete watershed. Our preferred lines up gullies, glaciers and couloirs are often at the extreme elevations of a watershed, if not right on the watershed boundary itself. Far downstream of this, where water may be used for agriculture, drinking water and other uses, observed changes may differ in magnitude, or in ‘direction’ (increases vs. decreases) altogether.
Streamflow at the bottom of a watershed is useful to consider since it represents the integrated response of a landscape to weather forces. It synthesizes hydrologic processes such as precipitation, evaporation, surface water runoff, groundwater and others. The observation of changes in streamflow, namely magnitude, timing and seasonal variation, combined with studies of changes in snow distribution, gives a more complete understanding of the hydrologic characteristics of a watershed and better reveals the main weather drivers of those changes.
This blog post has a simple objective. I will walk through a case study of detecting long-term changes in the climatological hydrographs of several rivers. What’s a hydrograph? It’s just a plot of the variation in time of the streamflow at a location. What’s climatology? It’s a long-term average. Often in meteorology and hydrology, 30-year averages are used to characterize the ‘state of affairs’ of some variable of interest. What do I mean by ‘long-term’ changes? Well, as long as possible, as you’ll see below. And, finally, when talking about change, we can talk about historical changes, or we can talk about projections or anticipated future changes. In this post, I am only going to look at historic changes. Why? Because they are our baseline…our points of calibration, if you will. They have actually happened, and help us to gain confidence in our ability to predict future changes as well.
Ok, the first step in doing a case study is to pick a location. And there is no better place to look at hydrology (or skiing and riding, for that matter) than Alaska (Figure 1). Why?
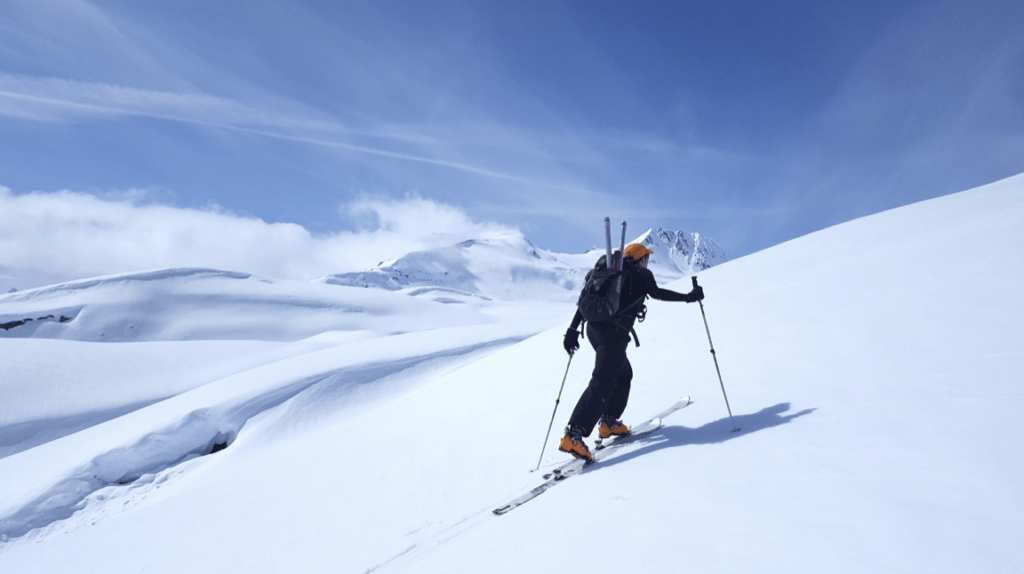
Figure 1: Checking out the snow science, and the skiing, at Thompson Pass, Alaska
- Amplitude. The precipitation inputs into Alaska are huge. And, this amounts to huge runoff volumes. In the Gulf of Alaska region, the runoff depth (water volume divided by the watershed area) averages about 10 times the runoff depth of the Mississippi River. And this runoff is hugely important to coastal oceanography and ecology. A recent study showed that estimating this runoff correctly was critical to being able to model nearshore currents and water transport pathways.
- Variety. Hydrology in Alaska has it all, including direct rainfall, snowmelt and large ice-melt contributions. A gigaton of water is one cubic kilometer, which amounts to nearly a half million Olympic-sized swimming pools. Well, Alaska has been shown to be losing about 75 gigatons of ice per year, which is very significant fraction of the overall runoff.
- Undisturbed watersheds. We are lucky to have a huge number of gauged (locations where streamflow is measured) watersheds in the United States. The Gages2 database by the United States Geological Survey (USGS) lists over 9000 just in the lower 48 states. However, a very large percentage of those have significant diversions or other consumptive uses. What this means is that the streamflow at the gauge location is significantly impacted by other than natural processes. This complicates the search for hydrologic change that is due solely to natural processes such as warming, vegetation changes and others.
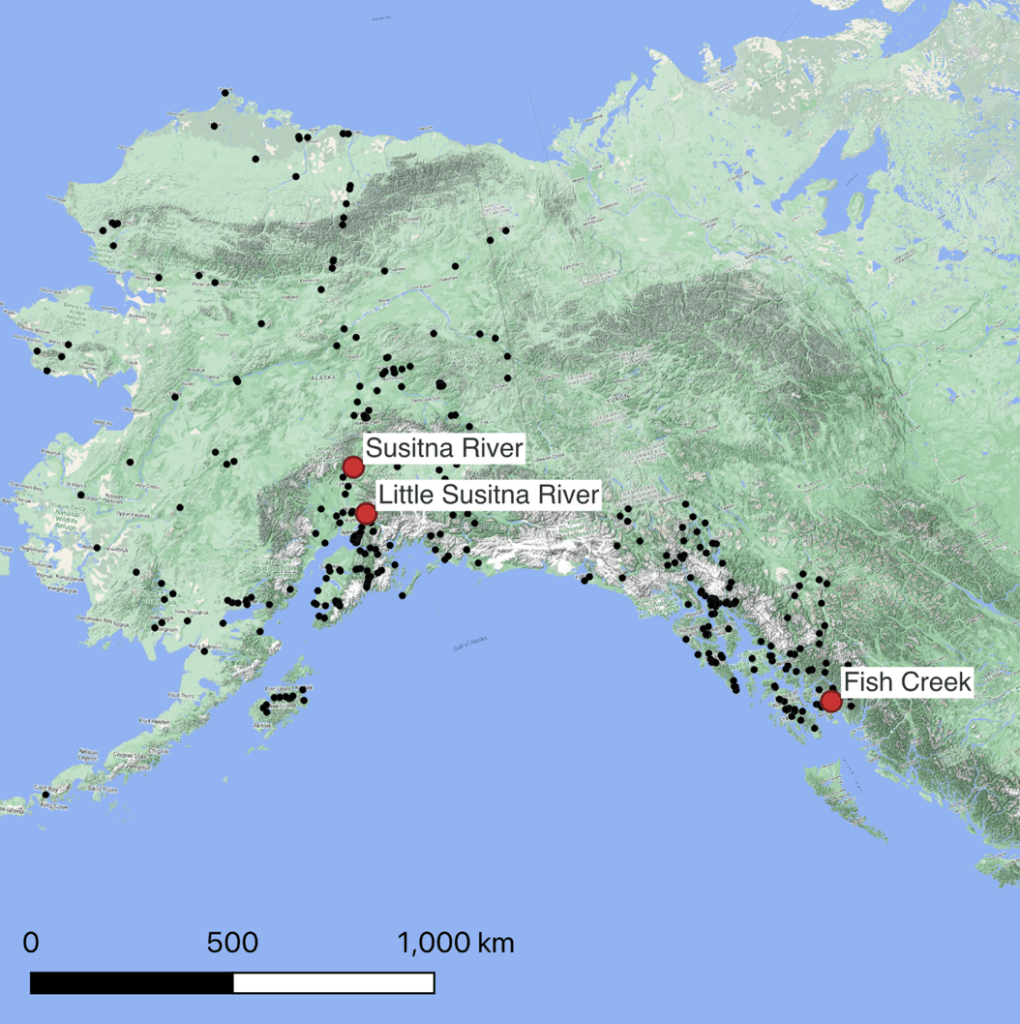
Figure 2: Overview map of Alaska with USGS gauges (black dots) and three particular gauges (red dots) used for analysis.
With Alaska selected as a location, the USGS gauges in that state were investigated (Figure 2). In addition to looking for relatively undisturbed watersheds, I looked for gauges that had complete records for the period 1950-1979 and also for the period 1990-2019. These two climatological periods (each 30 years long) are 40 years apart which is long enough to filter out shorter-scale variations such as the ENSO cycle. It is worth repeating that looking for changes in a much shorter record, say 10 years, can be misleading and this long period of 40 years is more suitable. This search produced only about 10 gauges to look at and the rest of this blog post will review a few of these.
Before doing that, however, it is useful to consider the general ‘categories’ of hydrographs. A recent study of Alaskan runoff reinforced a three-category scheme (Figure 3), which has been widely adopted in the past. The first category of the hydrograph is a rain-dominated hydrograph. In this case, the hydrograph shape is more or less approximately the rainfall distribution throughout the year. For much of Alaska, this amounts to peaks in runoff in May and October. The second category is a snow-dominated hydrograph. In these watersheds, there is a strong runoff peak from May to June, associated with annual snowmelt. Following that peak, the runoff will subside and subsequently be largely controlled by rainfall, with minor peaks in autumn. Finally, the third category is a high-elevation melt-dominated hydrograph. In this case, the runoff rises steeply in May or so, due to the onset of snow melt, but it remains elevated through September or so, due to the continuing melt of high-elevation snow and also the melt of glacier ice, exposed once the season’s snowpack has disappeared. These categories are rough in the sense that there are no hard boundaries between them. Some hydrographs are ‘in-between’ but the presence of a framework like this is useful for identifying the primary drivers of hydrograph shape.
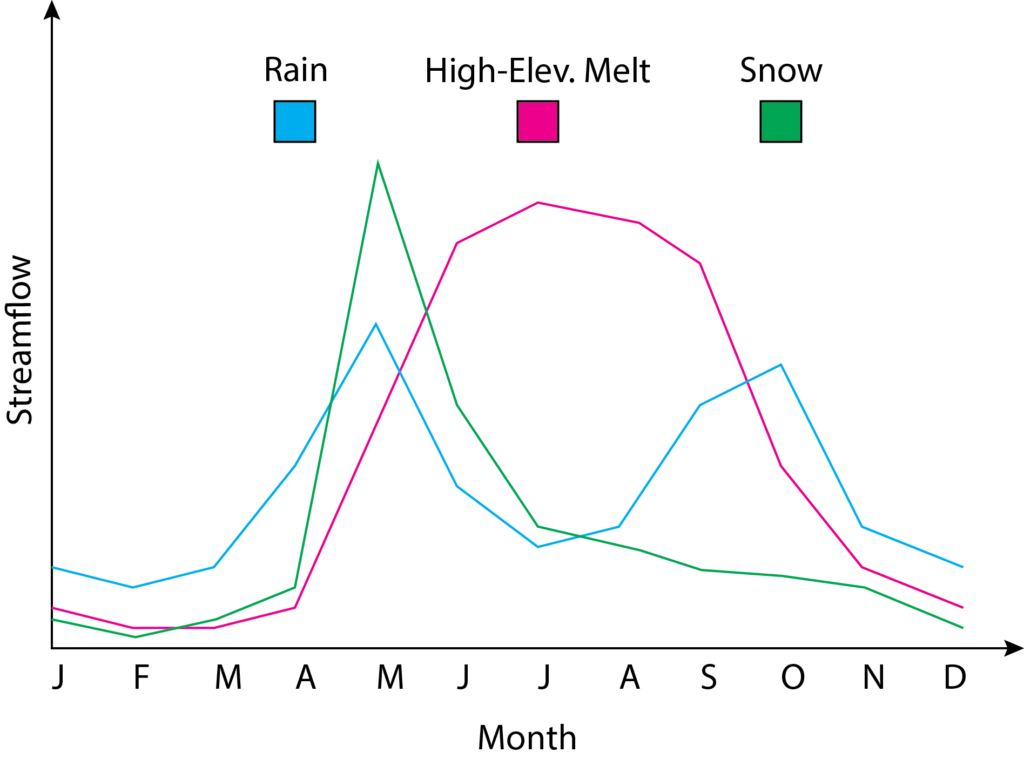
Figure 3: General categories of streamflow hydrographs in mountain environments.
To begin, let’s look at the Fish Creek watershed, near Ketchikan, in the southeastern Alaskan panhandle. This is a relatively small watershed at 90 square kilometers. It is essentially a rain-dominated watershed. Figure 4 shows both the past and the current hydrographs for this watershed. For each day of the year, there are thirty years of data. So, for each day of the year, a mean value for those thirty years was computed, and the minimum and the maximum values were also noted, to indicate the range of variability for each day. What is noteworthy in this watershed is that conditions from August through December have not changed that much. However, from January through August, there have been significant changes. In the past, flows were low early in the year and then rose in April and May due to snow melt. However, when we look at the current hydrograph, we see that it has flattened a lot. Flows are higher than in the past for January through April, and lower than in the past for April through August. This is due to more precipitation falling as rain throughout the winter. So, the late-spring snowmelt pulse has largely disappeared.
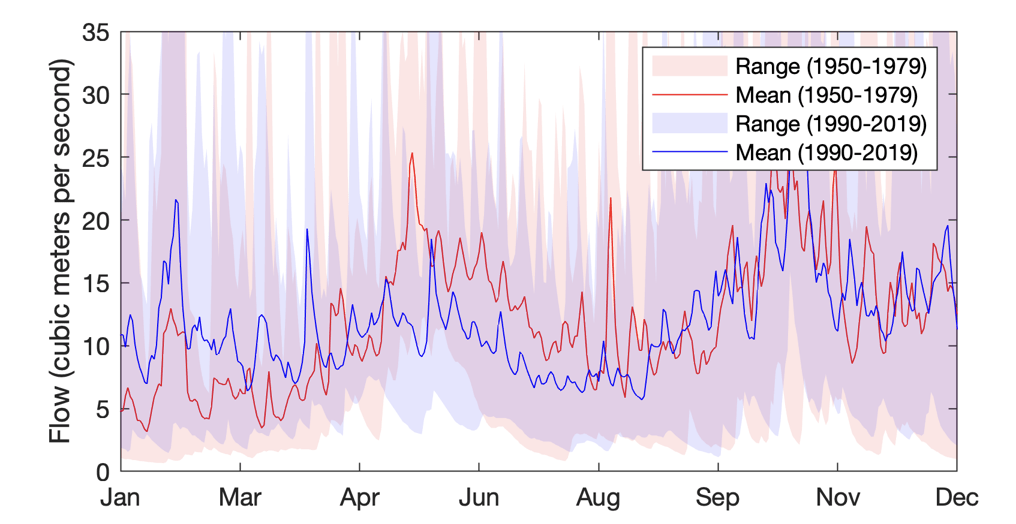
Figure 4: Historic and current hydrographs for Fish Creek.
Next, let us turn our attention to the Little Susitna watershed, near Anchorage. This is completely different geography, being part of the Talkeetna mountains. This is a slightly larger watershed, with an area of 160 square kilometers. Historically (Figure 5) this hydrograph has been at the boundary of a snow-dominated watershed and a high-elevation melt-dominated watershed. The historic hydrograph shows a strong increase in May and June due to snow melt, but the hydrograph retains moderately high flows throughout much of the summer before subsiding in autumn. The current hydrograph has some interesting differences. First of all, the onset of the snowmelt pulse is a full week earlier than in the past, due to warming temperatures. More interestingly is the overall change in the hydrograph shape. In this case, the summer flows are noticeably lower than they have been in the past. This may be due to reduced glacier cover, or reduced snowfall at the higher elevations in the watershed.
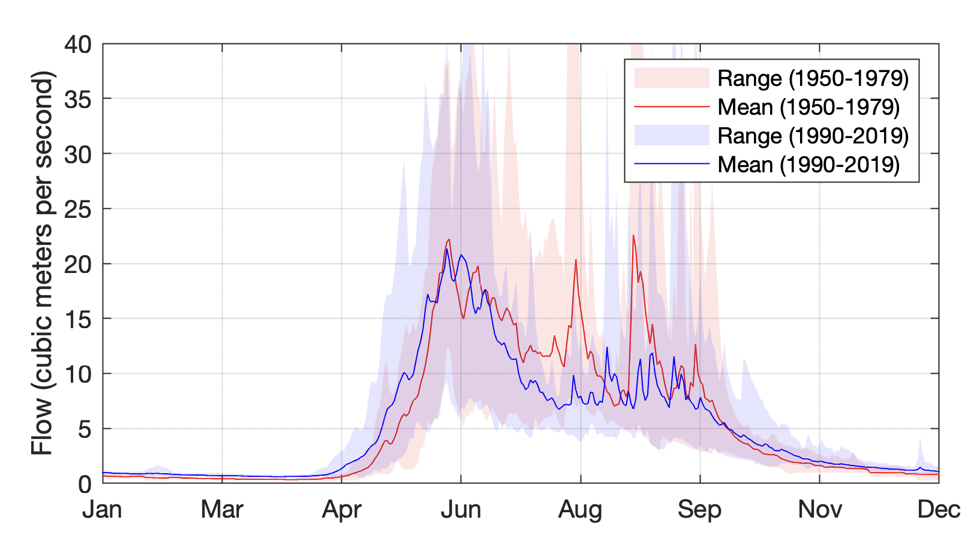
Figure 5: Historic and current hydrographs for the Chena River.
Finally, consider the Susitna River watershed (not the little one!) near Denali National Park. This is a vastly larger watershed with an area of 15,000 square kilometers. Its historic hydrograph (Figure 6) shows that this watershed is clearly dominated by high-elevation melt, which sustains flow throughout all of the summer. Interesting, when we look at the current hydrograph for this watershed, there is actually not much change observed in the past 40 years! This is likely due to two factors. First, this is a higher-elevation watershed than the other two, so it is ‘insulated,’ if you will, from modestly warming temperatures. At least for now. Second, it is a much larger watershed, so changes over a small portion are more or less damped, or masked, out by averaging over the entire area.
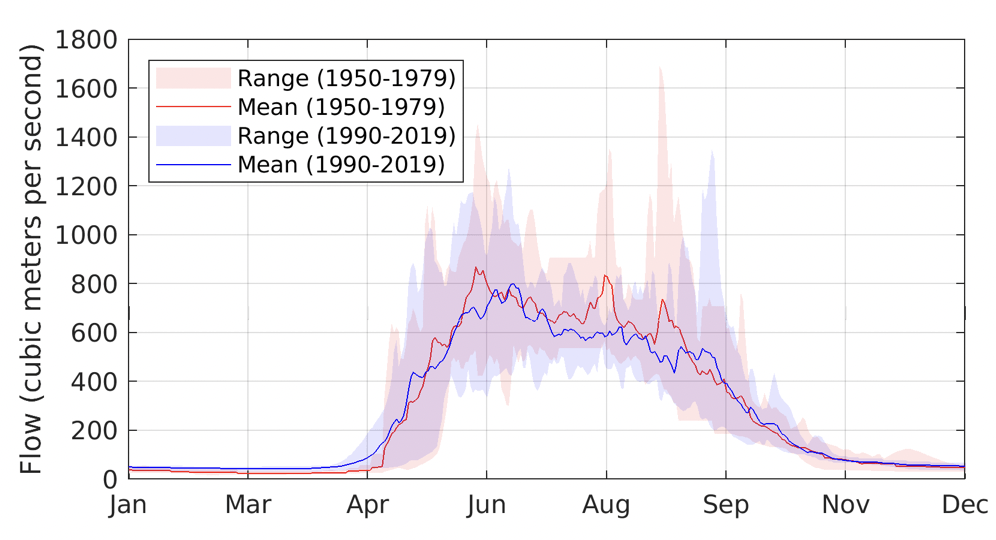
Figure 6: Historic and current hydrographs for the Susitna River.
In summary, hydrology in Alaska, both at any given moment and in how it changes over time, is breathtaking in its beauty and complexity. It is a location that functions as a perfect ‘living laboratory’ for connecting changes in precipitation and temperature to changes not only in the snowpack that we love to recreate in, but in changes to our water resources downstream. Studies such as this provide clear, incontrovertible baseline information on long-term changes in runoff due to a changing climate. These changes will impact how and when we use water, and impact the ability of our landscape to continue to provide numerous important ecosystem services. A firm grasp of recent historic changes and why they occurred will ultimately help us to best interpret, evaluate and plan for the wide array of scenarios that have been forecasted for our snow and water resources.
